

Internal test results
A document shall be created that records the results of executing the ML model ([V]) using the internal test data ([O]). The sufficiency of these results with respect to the defined ML safety requirements ([H]) shall also be documented.
The measures used to report the internal testing results shall be appropriate for the defined ML safety requirements ([H]).
Example 32 - Diagnosing for referral in retinal disease cases Healthcare
Figure 11 below shows an example of performance evaluation for a system that is designed to diagnose patients for referral in retinal disease cases. The model classifies each case into one of four possible classes (urgent, semi‐urgent, routine and observation). The costs associated with misclassification are not uniform (e.g. misclassifying an urgent referral as observation carries a higher weight than misclassifying a semi‐urgent referral as observation). For a single classifier model, (a) shows the true positive (hit rate) and false positive (false alarm) rates achieved for a set of test data as a threshold for identifying urgent referrals is varied. Hence varying this threshold allows us to select a trade-off that is acceptable for the system under test.
This is presented in the form of a Receiver Operating Characteristic (ROC) curve [20]. The right-hand graph in Figure 11 represents a detailed view of the highlighted area of the left-hand ROC curve. The star marker on the ROC curve indicates the acceptable trade‐off (“balanced performance”) for this system. We note that a perfect classifier would have zero false alarms and 100% hit rate, this would be positioned in the top left corner of the graph.
In order to compare the performance of this model with the existing system (i.e. human experts), eight specialists were asked to classify the test cases and their performance was plotted on the ROC curve. Where the specialist is to the right or below the ROC curve this indicates that the performance of the model is superior to the performance of the specialist.
While the ROC curve provides an aggregated assessment of model performance, a confusion matrix (b) [23] illustrates the model’s misclassification at the class level such that we can observe the type of misclassification made. For example, in the left-most matrix in Figure 11 the ML model misclassified 'Urgent' as 'Routine' 13 times, whilst in the central matrix specialist 1 makes the same type of error 20 times. For this type of misclassification, the ML model can therefore be considered to outperform specialist 1.
This example illustrates how multiple evaluation criteria may be required to be considered in order to assess the performance of an ML model for multi‐objective problems such as the retinal diagnosis system considered. A trade‐off is therefore required between different metrics in order to form a judgement on the acceptability of the model’s performance in the given context of use. It is also noted that a single comparator may not be possible especially in socio‐technical system such as this where human performance may vary considerably.
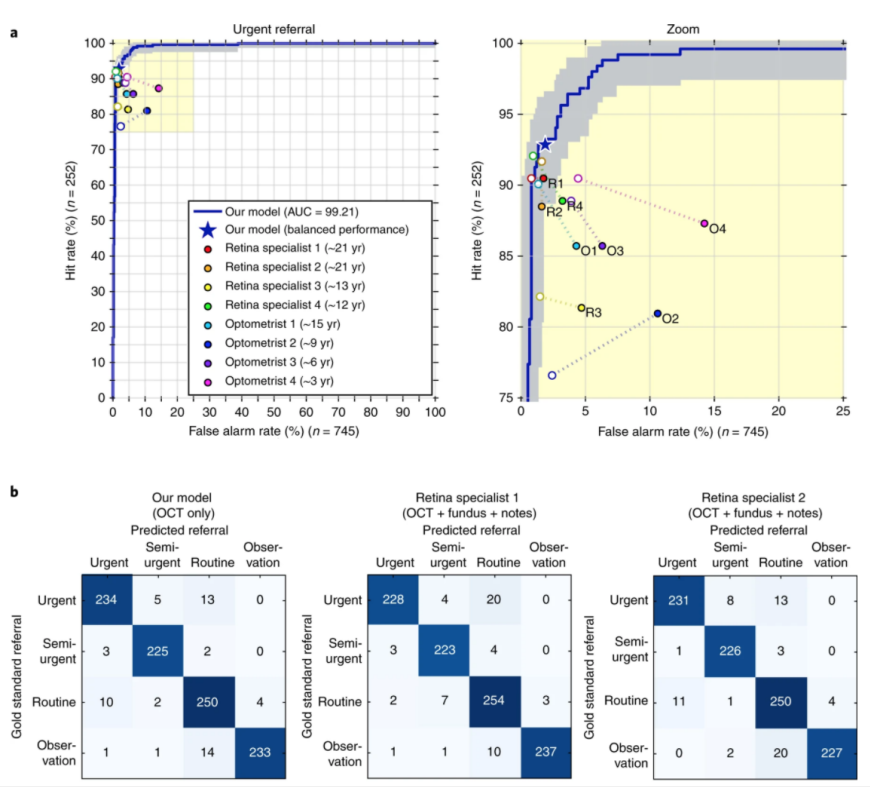
Figure 11: An example of model evaluation against different clinicians. Taken from [16]